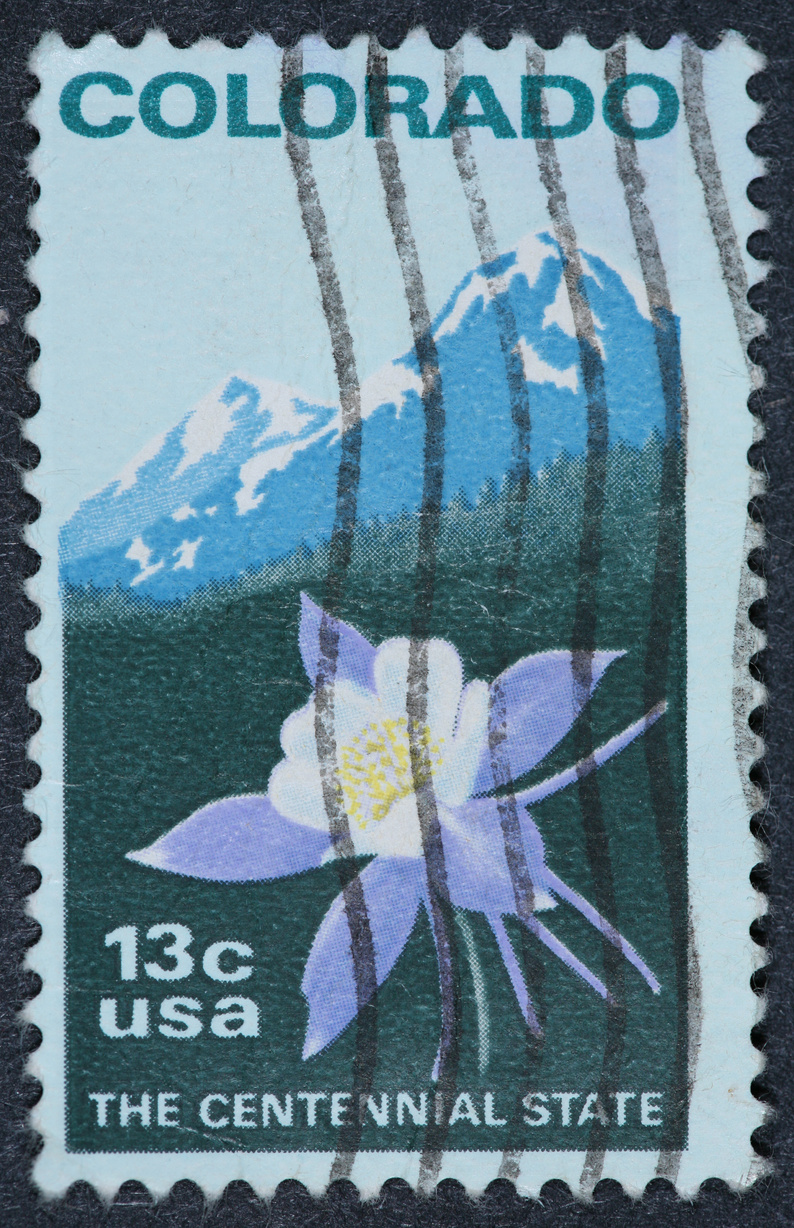
2023 Colorado Climate Report & Data Story
Heath Foster
Overview
In 2023, Colorado experienced a dynamic climate landscape, with significant shifts in temperature, precipitation, and ecological patterns. Rising temperatures accelerated drought conditions and exacerbated bark beetle infestations in forests. These infestations, coupled with prolonged dry spells, heightened the risk of devastating wildfires across the state. Through analysis, this report illuminates the relationships between climate change, ecological health, and wildfire susceptibility in Colorado, offering insights for informed decision-making and proactive mitigation strategies.

Methods
For this project, I collected and cleaned historic data on various environmental metrics in Colorado, including temperature, precipitation, snowpack, drought, forest pests, and wildfires. Then, I compiled the 2023 metrics for these variables and utilized predictive modeling techniques to make forecasts for 2024. Alongside these predictions, I provided recommendations for mitigating environmental issues based on the analysis of historical trends and patterns. To effectively communicate the findings, I created visualizations such as graphs, charts, maps, and text commentary, which were presented in a data story format on this website. This approach will allow stakeholders to understand the current environmental conditions, anticipate future trends, and implement proactive measures to address challenges in Colorado's ecosystem.

Series 1
Temperature
Colorado’s combination of high elevation, midlatitude, and continental interior geography results in a cool, dry, and invigorating climate. There are large seasonal swings in temperature and large day-to-night changes.
The climate of local areas is profoundly affected by differences in elevation and, to a lesser degree, by the orientation of mountain ranges and valleys concerning general air movements. Wide variations occur over short distances. For instance, the difference in annual mean temperature between Pikes Peak and Las Animas, ninety miles to the southeast, is 35 degrees—about the same as that between southern Florida and Iceland.
Statewide Historic Temperature Trends
Yearly Avg Temperature Tracking
For the 2023 water year (Oct. 1, 2022, to Sept. 30, 2023), Colorado experienced its coolest in several years, though was still above the 100-year average. Fall temperatures warmed up statewide with above or much above the 100-year average varying from region.
Yearly Temperature Departure from 105 Year Avg
2023 had cooler temperatures than recent years but still above long-term averages for the water year on record dating back to 1895.
CO Temperature in Perspective
Scientists have proven that very large emissions of greenhouse gases caused primarily by the combustion of fossil fuels are changing the Earth’s climate. Within the past century, the average temperatures of the earth’s surface have increased by 1.6°F since 1900 and .8°F since 1980 due to increasing atmospheric concentrations of greenhouse gases. This warming trend is also apparent in Colorado where the statewide annual average temperatures over the past 30 years have increased by 2°F, with increases across all seasons.
Temperature by County
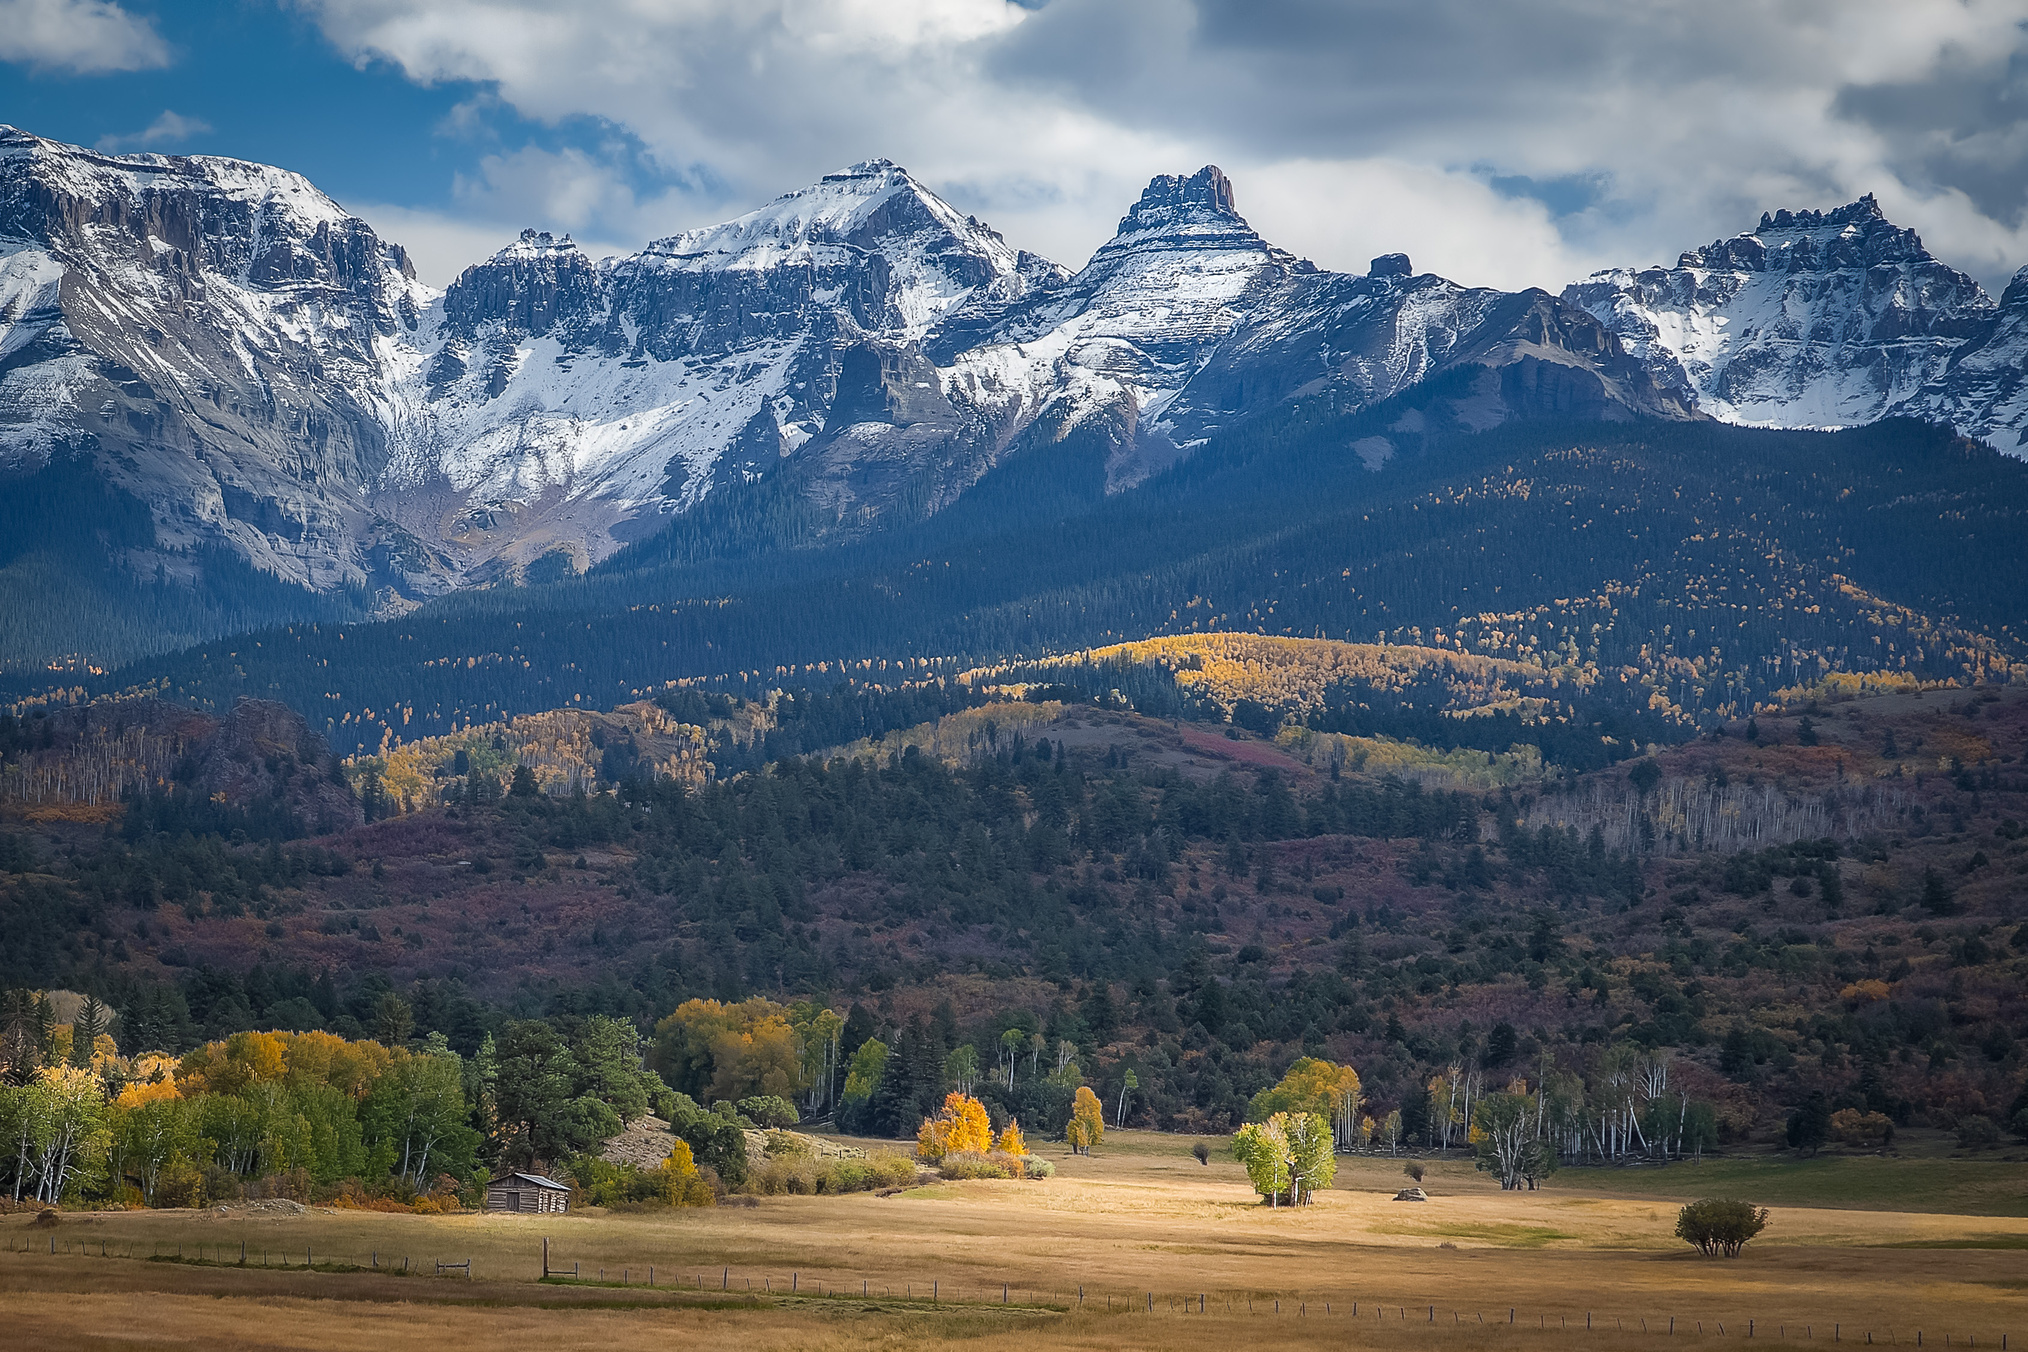
Colorado is best known for its mountains. They occupy less area of the state than many realize, but they profoundly impact the climate of the entire region. In general, temperatures decrease with elevation. Air heated at elevation quickly becomes unstable, causing it to rise and be whisked away from the land surface. This puts a low upper threshold on high temperatures at elevation. On clear and calm nights—especially with snow cover—the land surface effectively radiates away the day’s heat and the coldest, densest air settles into the mountain river valleys. Thus, the most extreme cold in the state of Colorado occurs in mountain valleys, not on mountain peaks, as shown by lighter shading to the right.
Optimal solar radiation levels for growing crops is between 250-300 (W/m2). Optimal soil temperatures for seed germination range from 68˚F - 86˚F, depending on the crop. The visualization shows that southeast CO is the still best location in the state for crop growing crops based on these metrics. However, these will need to be constantly reevaluated as decreasing water reservoirs and increasing temperatures impact the CO environment over the coming decades.
Solar Radiation and Soil Temps
Solar radiation measurement is crucial for climate change studies because it provides insights into variations in the amount of energy reaching Earth from the Sun. Consequently, farmers, and the whole field of agriculture, rely immensely on these measures as trends can influence plant growth, photosynthesis, and overall crop productivity.
Similarly, soil temperature drives the germination of seeds and directly affects plant growth. Most soil organisms function best at an optimum soil temperature.

Series 2
Precipitation
In Colorado, precipitation occurs in various forms (rain, snow, hail, etc.) and the amount varies seasonally, annually, and by location. Statewide, the average yearly precipitation is approximately 17 inches; however, there is a large range in the average annual precipitation across the state due to various topographical features.
Average precipitation slightly decreases moving from the eastern border with Kansas into the Colorado plains, but then tends to significantly increase moving further west into the higher elevations of the foothills and mountain ranges.
Historic Precipitation
While needing several years of adequate precipitation to build defenses against pests, trees in parts of Colorado did receive a respite from drought conditions last year. Data from the National Water and Climate Center show 33.48 inches of precipitation pouring into Colorado during the 2023 water year, compared to the 100-year average of 32.11 inches and ‘91-’20 average of 31.91 inches.
Regional Precipitation
Despite a wetter year, not all of Colorado received adequate precipitation. Rain drenched the Front Range (Denver) from May through early August to set records, while conditions remained drier than normal in the San Luis Valley (Pueblo, Grand Junction).
Precipitation patterns are largely controlled by mountain ranges and elevation and, to a lesser extent, the direction of prevailing airflow. When weather systems move in from the west and northwest during the winter and spring months, the peaks that first intercept the air receive the most precipitation. These areas are the wettest areas in the state of Colorado.
2024 Projected Precipitation
Water supply runoff volumes are expected to be below normal over the entire northern and southern portions of the Upper Colorado River basin, with near-normal levels over the central parts of the basin. Precipitation over the first half of March has helped to increase overall totals; however, the lack of winter precipitation in many basins will still impact seasonal runoff volumes. Consequently, Colorado will likely see below-average cumulative precipitation in 2024.

Series 3
Snowpack
High peaks and mountain ranges generally receive the majority of their precipitation during the winter months. Mountain precipitation primarily falls as snow from November through mid-May. This creates seasonal snowpack at about 9,000 feet, although it is lower in some areas.
The average snowpack in Colorado is lower than thirty years ago, but there is no statistically significant decreasing trend in snowpack. Climate modeling studies suggest Colorado's seasonal snowpack is vulnerable to projected increases in temperatures but less so than the Cascades and Sierras of the western United States.
Historic Snow Water Equivalent
SWE measures the amount of liquid water in the snow. If you took a height of snow and melted it, the height of the water created is the SWE. This number is vitally important for assessing runoff levels into Colorado’s basins.
The above-average precipitation for the northeast in 2023 helped replenish some below-average moisture in recent years, though it's unlikely to reverse drought impacts on trees across the state.
Projected Snow Water Equivalent
After a relatively moderate winter, a powerful snowstorm struck the Front Range of Colorado on March 13th and 14th. The state experienced a marked increase in SWE in March, ending the month at 112 percent of median snowpack. Statewide, precipitation for March was 155 percent of the median, and water year-to-date precipitation stands at 103 percent of the median. These conditions have improved streamflow volume forecasts statewide.

Series 4
Drought
Drought and its impacts vary from region to region—due to differences in climate. In Colorado and across the Intermountain West region (Wyoming, Colorado, Utah, Arizona, and western New Mexico), drought onset may occur quickly and last a season, or begin gradually and last decades. The Rocky Mountain regions rely on winter snowpack to sustain cities, towns, agriculture, and recreation. In the Southwest, the summer monsoons help people, and livestock, get through the hot summer months.
The U.S. Drought Monitor (USDM) identifies areas in drought and labels them by the intensities "None" (normal/wet conditions), "D0" (abnormally dry), "D1" (Moderate Drought), "D2" (Severe Drought), "D3" (Extreme Drought), and "D4" (Exceptional Drought). The chart below shows the total number of CO square miles in each category in a given week.
Statewide Drought Trends
Total CO Drought Classifications since 2018
Drought has wide-ranging economic, environmental, political, and social impacts. In Colorado, drought affects agriculture, industry, municipal supplies, recreation, and fish and wildlife populations. Moreover, snowpack deficits in the Colorado mountains can affect water supplies in states across the southwestern U.S.
2023 Total CO Drought Classifications
Despite monsoonal rains arriving last year in parts of Colorado, which relieved a majority of the drought categories, several years of adequate precipitation will be necessary for trees to recover their defenses. Drier than normal conditions occurred for the San Luis Valley once again.
DSCI and Annual Precipitation
The hot and dry conditions that have gripped the southwestern U.S. since 2000 accounted for the driest 22-year period stretching back 1,200 years.
Colorado droughts get significantly worse on a decadal basis as illustrated by peaking DSCI levels to the right. While research finds that there would be decadal droughts regardless of human intervention, climate change has made the past three cycles significantly worse.
Consequently, wildfire prevention must remain a heavy emphasis.
Possible values of the DSCI are from 0 to 500. Zero means that none of the area is abnormally dry or in drought, and 500 means that all of the area is in D4, exceptional drought.

Series 5
Forest Pests
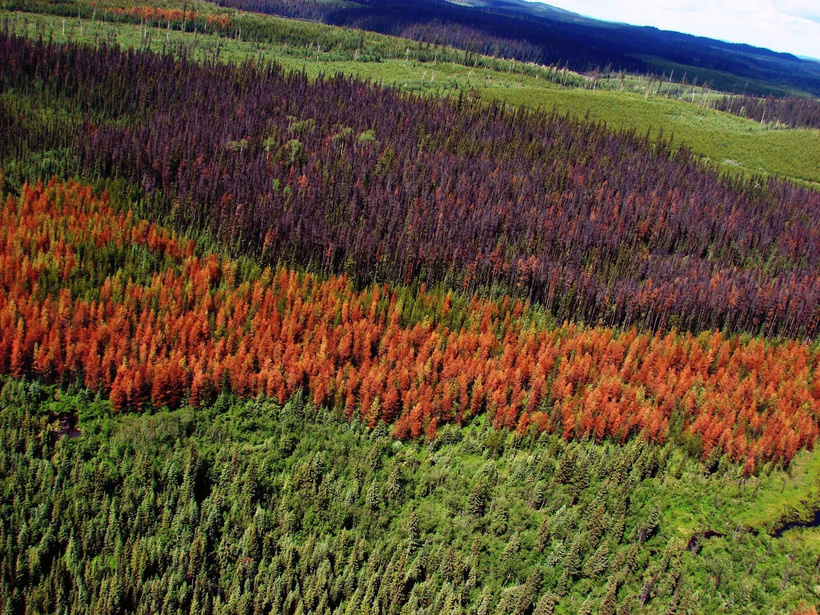
Widespread outbreaks of three important bark beetle species have occurred in Colorado’s forests since the turn of the century: mountain pine beetle, spruce beetle, and the western balsam bark beetle. These bark beetles primarily target large trees with reduced defenses due to lower precipitation amounts and higher temperature trends since the turn of the century.
While natural disturbances such as insect outbreaks and wildfires occurred historically and maintained forest health over time, multiple, simultaneous insect disturbances in the greater region over the past two decades have led to rapid changes in the state’s forests.
Struggling Forests
Damage from Above
Since the 1950s, forest managers have taken to the skies to detect and monitor disturbances to forests from insects and diseases, collecting data that provide an annual look at forest health in Colorado. With this information, managers can see how and where bark beetles and other pests are moving across the landscape and proactively manage these forests to lessen their impacts.
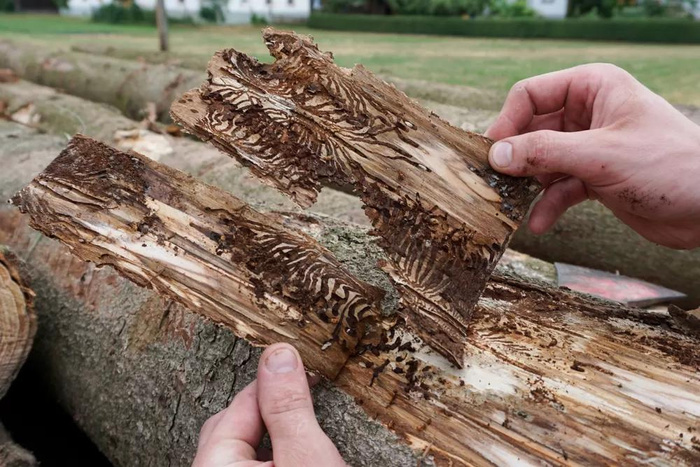
Damage up Close
Last year, trained aerial observers with the CSFS and USFS flew over 36.6 million acres of forests in small aircraft. Some of the areas spotted during flights were then ground-checked to verify the insect or disease responsible and the severity of the damage.
Forest Pest Trends
The western spruce budworm remains the most widespread forest pest in Colorado, according to aerial survey data from the CSFS and U.S. Forest Service Rocky Mountain Region. Data from the aerial survey also indicate that the western balsam bark beetle remains the deadliest forest pest for the second year in a row, despite it impacting fewer acres of Colorado’s forests in 2023.
Significantly, infestations paired with substantial wildfire years can convert dense forests to grasslands and restructure Colorado’s entire ecosystem.

Series 6
Wildfires
2020 saw the three largest wildfires in the state's history, which produced an almost inconceivable amount of damage to the region. These fires included the Cameron Peak Fire, the East Troublesome Fire, and the Pine Gulch Fire. While overall fire severity is down from the past few years, factors including a longstanding regional drought, the presence of increased tinder and dry grass, and the damage caused by bark beetles still push experts to predict a “normal” season, which could include over 5,500 fires burning 220,000 acres.
When enormous wildfires occur, soil in burned areas is much more readily eroded into our rivers, streams, and reservoirs. This impacts not only people but also the wildlife and ecosystems dependent on clean water. Wildfires also affect watersheds that are essential for irrigating crops—affecting the agriculture industry in Colorado.
Fire Trends and County Maps
Drought
After devastating burns, ponderosa and Douglas fir forests are converting to grass and shrubland after fires. The drying and warming climate mean fewer seedlings can establish themselves.
Lightning-Storm Frequency
Climate change-induced warm weather, drier conditions, and intense drought have increased lightning strikes and the susceptibility of forests to lightning-induced fires.
Climate Change
There is an underlying problem that is accelerating these fires—climate change. As the world warms, the Colorado forests are becoming drier—and therefore more susceptible to these mega-fires.
Timeline Wildfire Trends
Lightning Fires Decreasing
Summer rains reduce immediate fire risks in Colorado, but they also help vegetation grow throughout the state. As these plants dry out in winter, they become potential fuel for wildfires. High winds in Colorado, especially during the winter, can fan fires sparked by an increased number of lightning strikes. The Rocky Mountains create strong wind currents that can blow at 60-100 miles per hour and have pushed wildfires to a dangerous size in minutes.
Human-Caused Fires Decreasing with Challenges
Nearly 80% of wildfires are started by humans. Colorado’s growing population is expanding into the wildland-urban interface, and rising temperatures increase the risk of wildfire damage in communities. Homes and businesses are being built on lands that historically had regular wildfires. Land managers and property owners must work together to adapt properties so that firefighters can safely protect structures while allowing fire to positively impact the local ecosystem.
Recommendations
Thinning Fire Fuel
To return the forests to prime condition, the tree density and overall fuel loads must be reduced. Fire is a natural element in the landscape that maintains the forest structure and stimulates the germination of some species. However, fire suppression has allowed fuels to build up, causing the fires that do occur to be much more intense than usual. Rather than burning at low to moderate intensity, these fires burn hot enough to kill mature trees over large areas. Proactively thinning the forests and clearing out underbrush, through mechanical removal and controlled burns, will reduce the risk of severe fires.
Water Management
Within Colorado, most areas receive less than 20 inches of natural precipitation each year, so most of the state requires irrigation to grow crops or to support urban landscapes. About two-thirds of this water is also obligated to leave the state under various interstate compacts and agreements. About 80% of the water is on the Western Slope, yet about 90% of the state’s population resides on the Eastern Slope along with the majority of irrigated agriculture lands. New conservation plans must be presented to account for agricultural, municipal/industrial, and recreational needs, especially as the state population increases.
Planning for Drought
To help foster interstate coordination to cope with current and future droughts and growing water demands, NOAA’s National Integrated Drought Information System (NIDIS) launched the Intermountain West Drought Early Warning System (DEWS). Hoping for rain is not a drought strategy. A drought plan consists of 1) defining goals for ranch operation, 2) defining “trigger points” for decisions (or what information will prompt an action within a drought plan, 3) what strategies can be used to reduce the economic, ecological and social impacts of drought, 4) and deliberately learning about how well the plan worked.